What’s in a Feed Sample Report?
 Post-harvest is a time we find ourselves digging into the data. Harvest data that is! Corn silage data has several factors, and each livestock producer or nutritionist is different in which of those factors are most important. My main goal is to provide information needed to confidently compare hybrids for your spring crop plan.
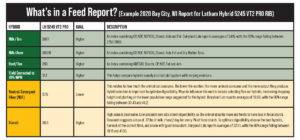
I have a Feed Report from one of our 2020 test plots with details on what each factor is telling us and how to apply that to product selections. For me, the top factors are: 1. Yield, 2. Starch Digestibility and 3. Fiber Digestibility. I’ve also appended the average ranges as typically reported by Dairyland Labs to help better understand the data.
- Yield: Yield fro
 m Latham® plots are measured in tons/acre and then adjusted to 70% whole plant moisture to remove the variability in results. Our goal here of course is higher, but there is a trade off on quantity per acre and quality per acre. This is where additional measures can come into play when making a final decision.
 - Starch Digestibility: When it comes to starch content, high values are most desirable. Low prolamin zein aids in starch digestibility. An animal that absorbs more tends to result in less fecal starch (discarded nutrients). Research suggests a loss of .72 pounds of milk per head per day for every 1% of fecal starch. While I don’t have a standard set of results on the beef side, but the concept of unused nutrition can be thought of similarly in a beef operation. To optimize digestibility, choose the best hybrids, harvest at the correct time and ensile with good inoculant. Dairyland Labs reports averages of 32.61 for a starch metric.
- Fiber Digestibility: Fiber digestibility relates to how much the animal can consume. The lower the number, the more animals consume and the more output they produce. Ways to influence this metric include selecting flex ear hybrids, increasing chopping height and planting at the lower population range suggested for the hybrid. Dairyland Lab reports averages of 39.68, with the 90% range falling between 33.43 and 49.2.
The rest of the feed sample report provides evidence to help further form an accurate comparison. Secondary factors I focus on include: Milk/Ton, Beef/Ton and Milk/Acre.
- Milk/Ton: Milk per ton is an estimate of the milk production from a ton of silage. It’s reported as an index that combines Crude Protein, Neutral-Detergent Fiber (and NDFD30), Starch, Ash and Fat. The goal is a higher number and Dairyland Labs reports averages of 3415.
- Beef/Ton: is an estimate of beef yield per ton of feedstuff. It’s reported as an Index combining NDFD30, Starch, CP, Neutral-Detergent Fiber, Fat and Ash.
- Milk/Acre: Milk per acre simply multiplies the milk per ton by the yield per acre. It’s reported as an index combining Crude Protein, Neutral-Detergent Fiber, NDFD30, Starch, Ash, Fat and Dry Matter Tons
Your Latham representative is ready to work together to achieve more yield in the field for better production at the bunk next season. Call them today to place your order for high-performance corn silage options from Latham Seeds.
